
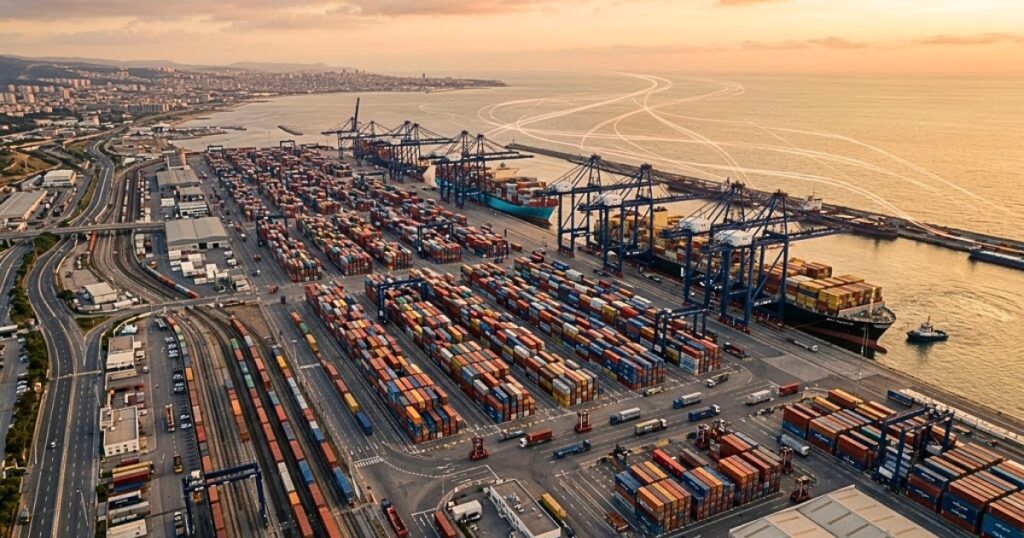
Electronics leads global trade with $12.1 trillion, while minerals and chemicals complete the podium in a market that keeps expanding worldwide.
The exchange of goods between countries has undergone unprecedented expansion since the turn of the century. According to available data, global trade volume reached $51.4 trillion in 2025, roughly four times the figure recorded in 2000. The number reflects just how much economic interdependence has deepened over the past two and a half decades.
The evolution of these flows is captured in a chart produced by Visual Capitalist, which combines information from the World Trade Organization (WTO), UN Comtrade and Econovis. The visualization shows how the product categories underpinning global exchange have been reshaped between 2000 and 2025.
Electronics, the Main Engine of Global Trade
Among all categories, electronics and electrical components stand out as the most significant. In 2025 they moved $12.1 trillion, more than triple the $3.2 trillion recorded at the start of the period. With that figure, the sector accounts for nearly a quarter of world trade, a share that underscores the central role of technology in the contemporary economy.
Minerals and Chemicals Complete the Podium
Second place goes to minerals, metals and related products, which totaled $7.3 trillion. This is one of the most striking trajectories in the study: its value grew 5.6-fold over these 25 years, outpacing the market as a whole.
Third place is held by chemicals, plastics, rubber and their derivatives, with $7.1 trillion. Their narrow gap with the category ahead of them points to close competition between the two segments for second place.
Agriculture and Machinery: Lower in the Ranking, but Rising Fast
At the bottom of the ranking are agriculture and food, with $4.7 trillion, and machinery and mechanical equipment, with $4.5 trillion. Although they occupy the last positions, both sectors performed remarkably well: the former grew 5.2-fold and the latter 4-fold compared with 2000 levels.
The Big Picture
The figures paint a picture of global trade that has not only grown in volume but also changed in composition. Goods tied to technology and industrial inputs have gained prominence, while even traditional sectors such as agri-food have posted major gains. Taken together, the quarter-century under review confirms a trend of sustained expansion in international trade.